The goal of this lab was to examine different procedures of detecting land use / land cover (LULC) change over time with satellite images. The procedures and methods used in this lab allowed qualitative, quantitative, and LULC from-to information.
Methods
Part I: Change Detection using Write Function Memory Insertion
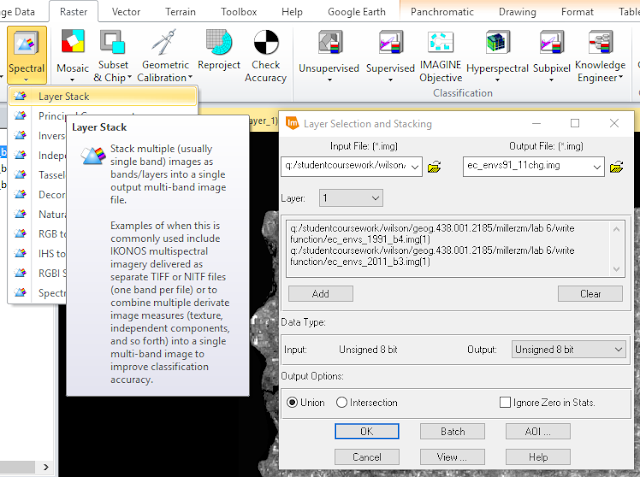
In the first part of this lab, the goal was to visualize changes in LULC by assessing significant differences in the near infrared bands of two satellite images taken 20 years apart. To do this, a layer stack was performed on the two images using the Raster>Spectral tool set in ERDAS Imagine. The output image was given a name and storage location.
 |
| Figure 1: Performing a layer stack on the 1991 and 2011 images. |
 |
| Figure 2: Setting layer combinations. |
Section I:
In the second part of this lab, the goal was to practice deriving quantitative data from change detection. To do this, the class and histogram values of two classified images covering the Milwaukee Metropolitan Statistical Area (MSA) were put into an excel sheet to calculate the percentage of change within each class.
 |
| Figure 3: Class coverage in hectares (Ha) and the percent of change between within each class between 2001 and 2011. |
Section II:
Although in the last section, the percent of change for each classification was determined, information regarding what classes changed from-to was not. In this section of the lab, the two images of the greater Milwaukee MSA from 2001 and 2011 were brought into model builder to determine class changes between the two image dates. The from-to changes were:
1. Agriculture to Urban/Built up
2. Wetlands to Urban/Built up
3. Forest to Urban/Built up
4. Wetland to Agriculture
5. Agriculture to Bare Soil
 |
| Figure 4: Class Values used for model builder function. |
 |
| Figure 5: Testing for wetland areas in 2001 image. |
 |
| Figure 6: Testing for Urban/Built up areas in 2011 image. |
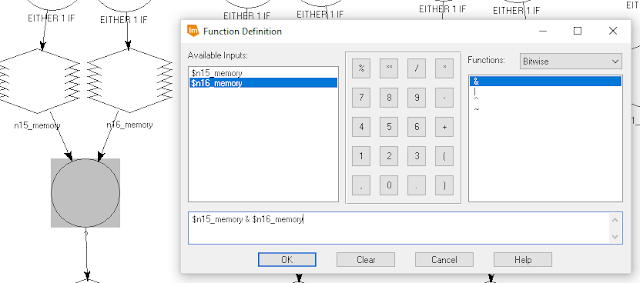
By using the two images as inputs for 10 functions within model builder, the images were tested for the various from-to classes in question using a conditional statement. In figures 5 and 6. The 2001 and 2011 images were being tested for wetland and urban/built-up land. All wetland areas within the 2001 image were assigned a value of 1 and all others, 0. All Urban/Built-up land in the 2011 image was assigned a value of 1 and all others, 0. This produced a binary image for both years, which were then used to determine which land changed between the two dates.
 |
| Figure 7: Bitwise function used to compare the two images. |
The images were then brought into ArcMap to visualize the from-to changes.
Results
 |
| Figure 8: Agriculture to Urban/Built-up Change Detection Map. |
 |
| Figure 9: Wetland to Urban/Built-up Change Detection Map. |
 |
| Figure 10: Forest to Urban/Built-up Change Detection Map. |
 |
| Figure 11: Wetland to Agriculture Change Detection Map. |
 |
| Figure 12: Agriculture to Bare Soil Change Detection Map. |
The various mapped results display different amounts of from-to changes. The change between 2001 and 2011 from Agriculture to Urban/Built-up land (Figure 8) is quite extensive as compared to the change from Agriculture to Bare Soil (Figure 12).
Conclusion
Looking at the methods used in Part 1 of this lab, the Write Memory Function does a good job of highlighting whether or not change occurred in the area of study over two dates, but did not provide quantitative information regarding what changed and what from-to.
Looking at the results from Part II, the Post-Classification Comparison Change Detection method provided information about what changes occurred between the two image dates and was relatively easy to perform using the Wilson-Lula method in Model Builder. This process also provided quantitative information regarding percent change, which was not given by the Write Memory Function.
Sources
Classified images provided by Dr. Cyril Wilson
Processing executed in ERDAS Imagine
Cartography completed in ArcMap 10.5.1


No comments:
Post a Comment