Methods
Part I: Generating Ground Reference Testing Samples for Accuracy Assessment
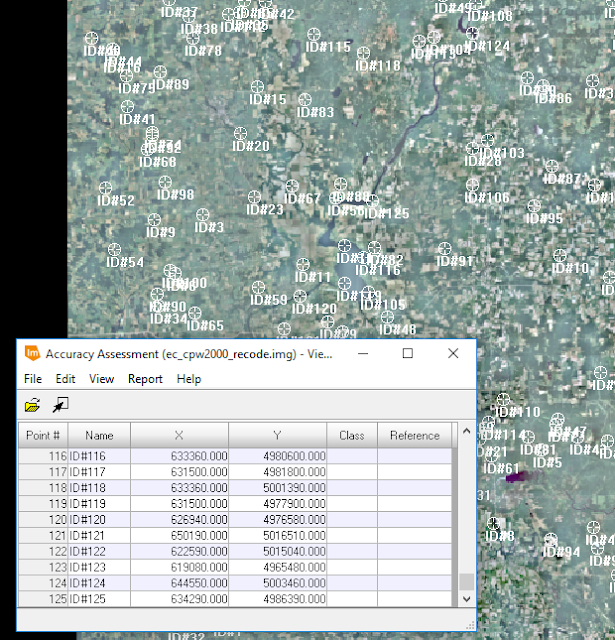
In the first part of this lab, the classified image created in Lab 3 was used in conjunction with a high-resolution image of the same area from the National Agriculture Imagery Program (NAIP) to assess the accuracy of the classified image. First, sample testing points were generated. This was completed by using the Accuracy Assessment raster tool in ERDAS Imagine.
 |
| Figure 1: Adding random sample points to the reference image (high-resolution image on right). |
 |
| Figure 2: Randomly generated points. |
The points were then classified, 10 at a time, using the same classification scheme from Lab 3 and the reference image to determine the true land use/cover. Once this was done, an accuracy report was generated using the Report > Accuracy Report and interpreted to determine the overall accuracy of the classified imagery.
 |
| Figure 3: Accuracy Report Totals. |
 |
| Figure 4: Error Matrix for the unsupervised classified image. Classes displayed along Y-axis and the reference image is displayed along the X-axis. |
Part III: Accuracy Assessment of Supervised Classification
For the third and final part of this lab, the same processes completed in parts one and two were completed for the supervised classified image created in Lab 4. The Accuracy Report was generated,
 |
| Figure 5: Accuracy Report Totals. |
 |
| Figure 6: Error matrix for the supervised classified image. |
Looking at the resulting error matrices and accuracy reports, the unsupervised classified image was more accurate than the supervised classified image. While both the producers and users accuracy in the unsupervised and supervised images were 0%, the forest and agriculture classes were more accurately classified in the unsupervised image than in the supervised image. The bare soil class was more accurately classified in the supervised image than in the unsupervised image, however. In terms of reliability (user's accuracy), the forest and bare soil classes in the supervised image are trustworthy in the supervised image than in the unsupervised image and the agriculture class displayed the opposite.
Conclusion
Overall, the accuracy of any class, with the exception of water, in either classification method was less than impressive. Considering that the urban/built-up class is considered completely unreliable by the accuracy report, although there are some areas that are correctly classified as such in either image, this is an area of much concern. Aside from water, forested lands were the only acceptable class in either image for reliability, as agricultural and bare soil areas fell below 40% confidence in both accuracy reports. Perhaps the random sample point selection method is to blame for disproportionally placing points on forested areas where it would have been helpful to have more points placed on urban areas to better determine the accuracy of that class.
Sources
Reference images collected by the National Agriculture Imagery Program (NAIP)
Accuracy assessment completed in ERDAS Imagine
Error matrices designed in Microsoft Excel
References:
Accuracy Metrics. (n.d.). Retrieved March 14, 2018, from http://gsp.humboldt.edu/olm_2016/Courses/GSP_216_Online/lesson6-2/metrics.html
Reference for "Producer and User Accuracy"


Alfa Chemistry agriculture & crop analysis is a leading testing service in the assurance, testing and inspection of agricultural commodities. Agriculture & crop quality safety refers to the reliability, Agriculture & Crop testing
ReplyDelete