The goal of this lab was to build on knowledge of classification methods obtained from previous labs by examining advanced classification schemes. Differing from un/supervised classification methods, advanced classifiers use complex decision trees and neural networks to learn from user input and build a classification scheme in an image.
Methods
Part I: Expert System Classification
The first advanced classifier used in this lab was an "expert system". An expert system uses the spectral information from the image to generate a classification scheme, much like un/supervised algorithms, but also as much ancillary data as is available. So information regarding temperature, soil, zoning, population, and a plethora of other information that supplements assessment of the surface features in the image is used to generate a better than minimum threshold classified image.
To begin the expert system classification process, a classified image was brought into ERDAS Imagine and observed. This was done by comparing the classified image to a Google Earth image of the same area. The greatest misclassified fields were lawns and other open grass areas that were classified as agriculture- this was corrected using the expert classification scheme. Through this process, the "urban/built-up" class was split into "residential" and "other urban" as well.
Once the classes needing correction were identified, the Knowledge Engineer raster tool was used to train the classifier.
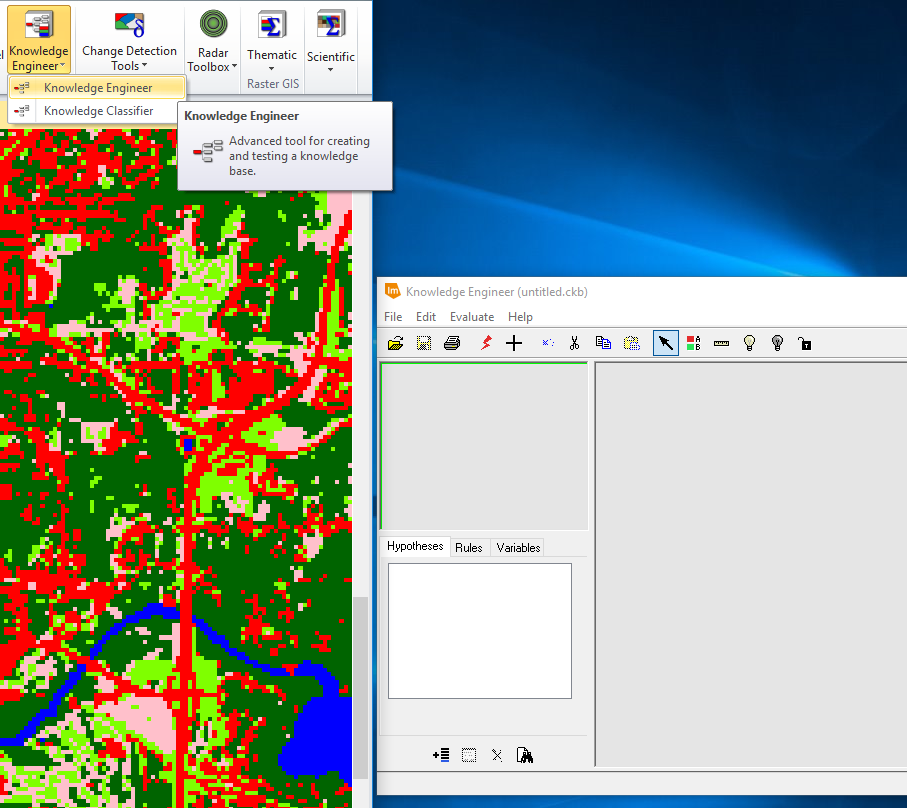 |
| Figure 1: Opening the Knowledge Engineer raster tool. |
 |
| Figure 2: Setting rules for class values within the Knowledge Engineer. |
 |
| Figure 3: Finalized Knowledge Engineer trainer. |
Once the Knowledge Engineer was finished, the engineer was ran to verify that the trainer was set up properly. The engineer was then used to train the Knowledge Classifier raster tool.
 |
| Figure 4: Inputting parameters to the Knowledge Classifier. |
Part II: Neural Network Classification
The second part of this lab focused on a different kind of advanced classifier-- the Neural Network classifier. This classification method simulates a network of neural pathways in the human brain. To do this, ENVI software was used. First, an image was brought into the software and the color bands of that image were selected to bring the image into a viewer.
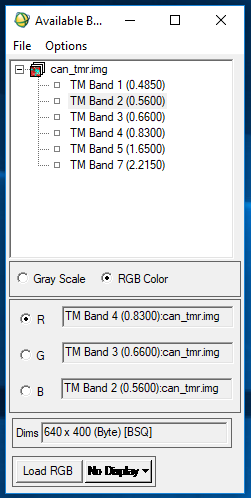 |
| Figure 5: Selecting color band combination to display a false color image. |
 |
| Figure 6: Restoring ROIs. |
 |
| Figure 7: Starting neural network classification. |
 |
| Figure 8: Establishing parameters for neural network. |
Results

 |
| Figure 10: Expert classification result. |
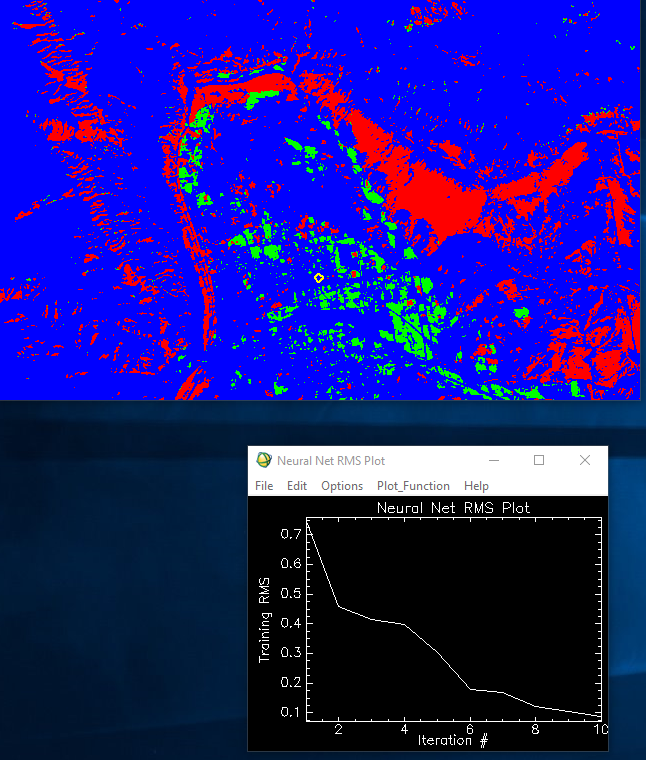 |
| Figure 11: Neural Network output image and RMS plot. |
Conclusion
The expert system classification has proven to expertly distinguish differences and therefore, enhance classified imagery. Despite the inability to combine classes that were split in the knowledge engineer (ie. green vegetation [1 and 2] and agriculture[1 and 2]), which was most likely user error, the method adequately supplements the original classification to create a more accurate output and give the viewer a better understanding of the LULC within the study area.
As for the neural network, the objectives and output seem less clear. The resulting classes seem meaningless or at least indistinguishable as to what they are supposed to represent. The overall process and software was confusing to operate and derive meaningful results from. Having worked through the lab and read the support documents for what the system and function do, I still don't have a good grasp on how either work or what the point of using them is.
Overall, I was quite pleased, and frankly surprised, at the output generated from the expert system classification and could envision using that method for future projects having to do with classification. I would be interested to learn more about the functionality and various uses for employing a neural network classifier, as I felt that the scenario for this assignment didn't provide enough information to allow me to fully grasp the concepts of this classification method.
Sources
Department of Geography, University of Northern Iowa [Quickbird Highresolution Image]. (n.d.).
Earth Resource Observation and Science Center [Landsat Satellite Images]. (n.d.).
United States Geological Survey [Landsat Satellite Images]. (n.d.).
ment of Geography, University of Northern Iowa [Quickbird Highresolution Image]. (n.d.).
Earth Resource Observation and Science Center [Landsat Satellite Images]. (n.d.).
United States Geological Survey
Department of Geography, University of Northern Iowa [Quickbird Highresolution Image]. (n.d.).
Earth Resource Observation and Science Center [Landsat Satellite Images]. (n.d.).
United States Geological Survey [Landsat Satellite Images]. (n.d.).
Department of Geography, University of Northern Iowa [Quickbird Highresolution Image]. (n.d.).
Earth Resource Observation and Science Center [Landsat Satellite Images]. (n.d.).
United States Geological Survey [Landsat Satellite Images]. (n.d.).
Department of Geography, University of Northern Iowa [Quickbird Highresolution Image]. (n.d.).
Earth Resource Observation and Science Center [Landsat Satellite Images]. (n.d.).
United States Geological Survey [Landsat Satellite Images]. (n.d.).
Department of Geography, University of Northern Iowa [Quickbird Highresolution Image]. (n.d.).
Earth Resource Observation and Science Center [Landsat Satellite Images]. (n.d.).
United States Geological Survey [Landsat Satellite Images]. (n.d.).


No comments:
Post a Comment